The Freedom Blueprint (August ’26 Edition)

After the political drama that dominated last month’s edition, August has been all about the metals. Gold and silver have spent the best part of seven months coming off the extraordinary highs they set back in January, and if you hold precious metals miners – as our US Active 10 very much does – it has been a fairly bruising period to sit through.
The better news, at the time of writing, is that the picture has started to shift. A weak US jobs report at the beginning of the month knocked a sizeable hole in the rate-hike thesis that caused the slide in the first place, and both metals have responded. Whether that is the turn, or simply a bounce that fades, is the question I have spent a good deal of time on this month with Cedric’s help. It is the subject of the lead article below.
Meanwhile our diy-investors portfolios have been telling two very different stories: the UK Active 10 finished July up by over 34%, whilst the US Active 10 portfolio was down by nearly 7%. Same investor, same approach, very different sector mix – and there is a lesson in that. What has happened since is the more interesting part, though: a fortnight into August the US Active 10 is back above where it started, for reasons that will not surprise you once you have read the lead article. It also lies behind a couple of moves I made in early August (see Mick’s Musings).
Gold and Silver: Is the Slide Ending?
Let me start with where we actually are. Gold peaked at $5,598.75 on 29th January 2026 and silver at an all-time high of $121.64 in the same month, after a gain of over 330% in roughly twelve months. Both then fell hard – gold to a June low near $3,958, silver to a July low of $54.77. As at Friday 14th August’s close, gold stood at $4,375.50 and silver at $64.66 – silver still some 47% beneath January’s spike, and gold some 22% below its own.
The case for the slide ending is the strongest it has been all year. The whole cause of the decline was the rate-hike thesis, with both metals shedding roughly 29% from their January highs as the Federal Reserve’s hawkish turn, under new Chair Kevin Warsh, reshaped expectations and the dollar climbed to a 13-month high. That has now reversed sharply. July non-farm payrolls unexpectedly fell by 23,000 against expectations of a 80,000 gain – the first decline in five months – cutting September hike odds to 44% from 58% and pushing the dollar index to a seven-week low. Gold gained more than 7% in the week those payrolls landed, and it has held that ground since, edging higher again to close at $4,375.50 on Friday 14th August.
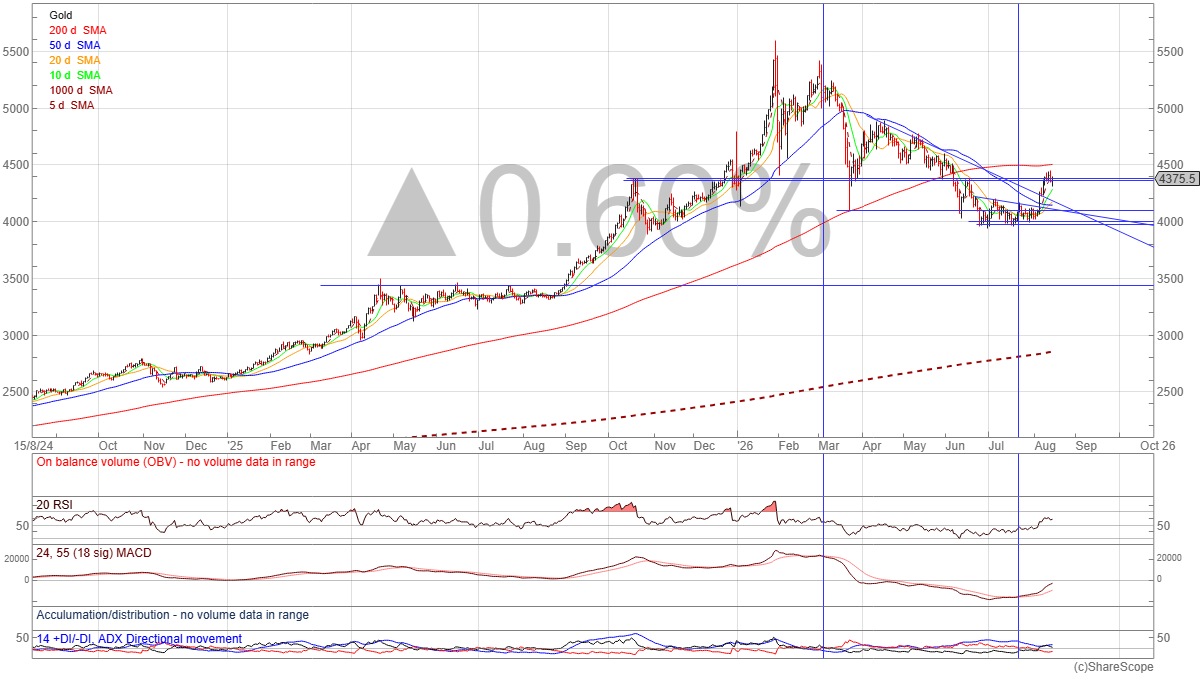
Gold, two-year daily chart to 14th August 2026 (Peak $5,598.75 on 29.01.2026, June low $3,958, close $4,375.50). Source: ShareScope.
Coupled with that, there is the buyer nobody talks about enough. The People’s Bank of China (PBoC) bought 640,000 ounces (about 20 tonnes) in July, its largest monthly increase since October 2023 and the 21st consecutive month of accumulation, taking reserves above 76 million ounces. Note that they bought straight through the crash – the worst quarterly decline in thirteen years – and that gold is still under 10% of China’s foreign exchange reserves against roughly 70% for the US and Germany. Put another way: for China to hold gold in anything like the proportion the West does, it would have to keep buying at this rate for years yet. That is a great deal of patient demand sitting underneath the price, and it does not much care what the Federal Reserve does next.
Notwithstanding all of that, the counter-case is real. MUFG (Mitsubishi UFJ Financial Group) and UBS both argue the rally lacks a clear catalyst for a sustained breakout, expecting gold to hover around $4,000 through 2026, and roughly 298 tonnes of gold held in exchange-traded funds (ETFs) sits underwater near that level, forming a supply ceiling on rallies. The Elliott Wave counts are split too, and rather dramatically so: one credible reading projects $4,900 building to $6,000, another has an extreme downside target of $3,040 to $3,400. Silver’s structure is the more cautious of the two – its bounce has run straight into the $62 to $67 resistance zone, and needs to prove itself above $67 or the larger correction resumes.
So, two levels settle the argument, as far as I’m concerned: a weekly close above $4,400 in gold and above $67 in silver. Below those, perhaps we should treat this as a bear-market bounce and keep our powder dry. This is not advice, of course – and the fact that two respected analysts hold counts pointing to $6,000 and $3,040 respectively tells you just how much interpretation is involved.
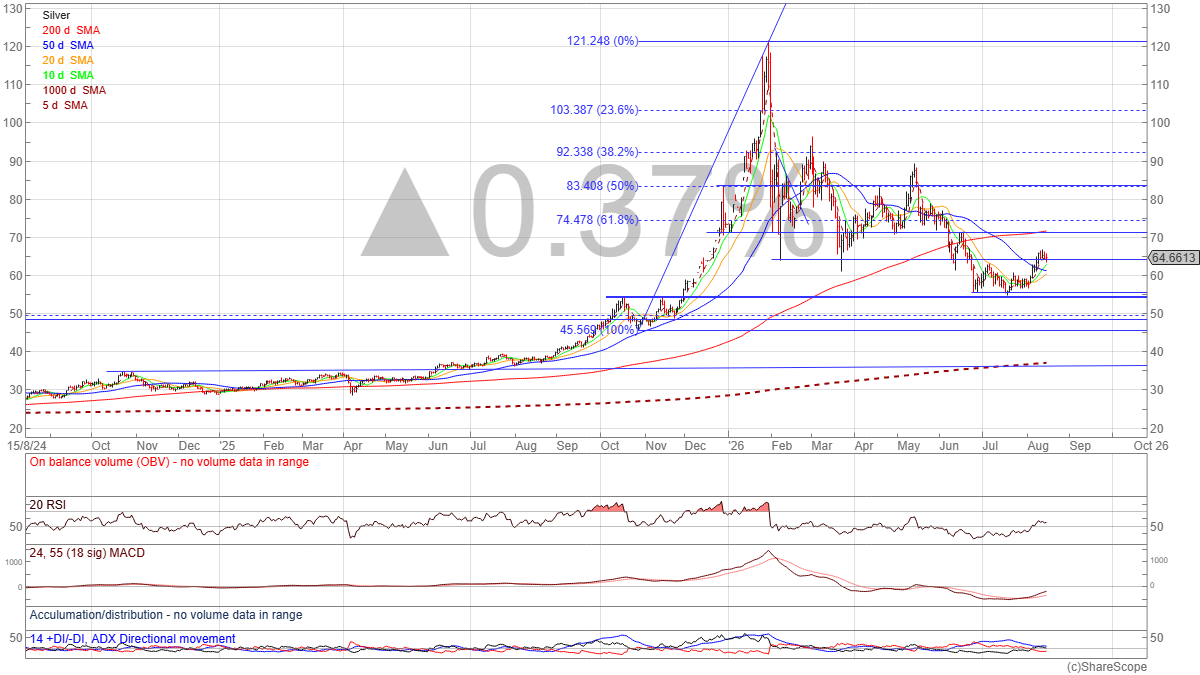
Silver, two-year daily chart to 14th August 2026, with Fibonacci retracements from the January high of $121.64. Note the $62 to $67 resistance zone, with silver closing at $64.66. Source: ShareScope.
DIY-Investors Portfolio Updates
UK Active 10 Portfolio
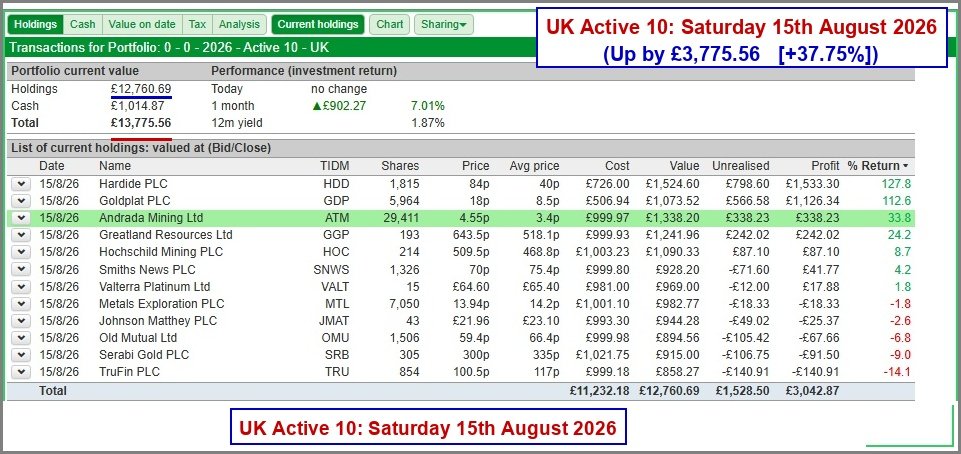
UK Active 10: Saturday 15th August 2026 – Up by GBP 3,775.56 (+37.75%)
As at Saturday 15th August 2026, the UK Active 10 stood at GBP 13,775.56 against its GBP 10,000 start – up by GBP 3,775.56, or 37.75%. The last month added GBP 902.27 (7.01%). Hardide [HDD] remains the star turn at +127.8%, with Goldplat [GDP] close behind on +112.6% and Andrada Mining [ATM] on +33.8%. Greatland Resources [GGP] has added 24.2%, and Hochschild Mining [HOC], bought this month, is already up 8.7%. At the other end, five holdings are still under water, led by TruFin [TRU] (-14.1%), Serabi Gold [SRB] (-9.0%) and Old Mutual [OMU] (-6.8%).
Transactions
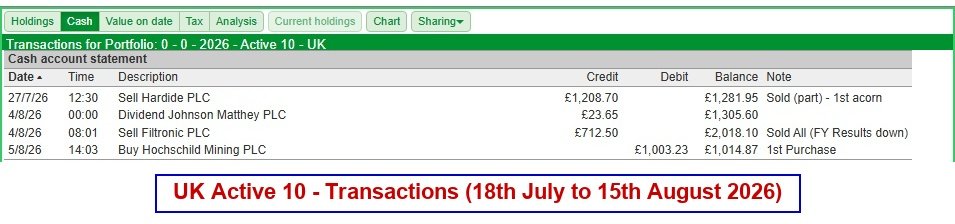
Since the last newsletter (18th July 2026), there have been four items in the UK Active 10: the part-sale of Hardide PLC on 27th July raising GBP 1,208.70, a dividend from Johnson Matthey PLC (4th August, GBP 23.65), the sale of the remaining Filtronic PLC shares on 4th August raising GBP 712.50, and the purchase of Hochschild Mining PLC on 5th August for GBP 1,003.23. That left the cash balance at GBP 1,014.87.
It’s interesting to compare the difference between the (reasonably) balanced portfolio in the UK Active 10 and the Precious Metal Mining focus in the US Active 10 Portfolio (below) – and this month that difference has worked the other way round.
US Active 10 Portfolio
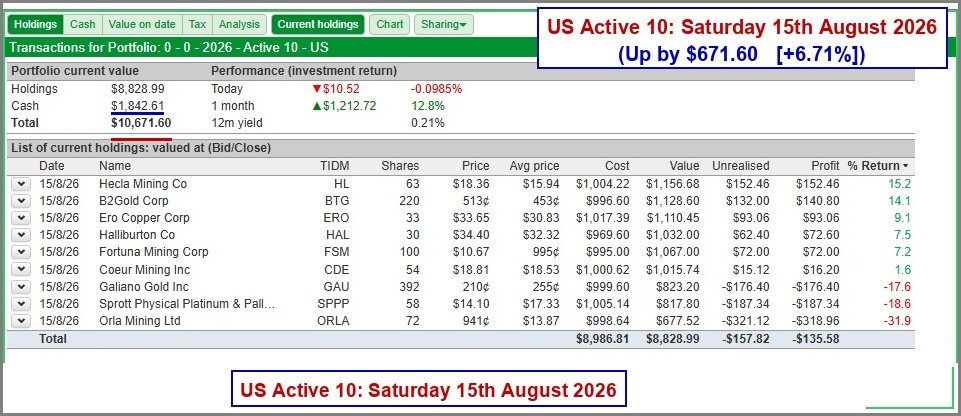
US Active 10: Saturday 15th August 2026 – Up by USD 671.60 (+6.71%)
The US Active 10 is where the lead article stops being theory. At the end of July it stood at USD 9,310.19, down 6.89% against its USD 10,000 start. As at Saturday 15th August it stood at USD 10,671.60 – up by USD 671.60, or 6.71%, and back above where it began. That is a swing of more than 13 percentage points in a fortnight, and it is no mystery: this portfolio is concentrated in precious metals miners, so when gold and silver turned in the first two weeks of August, it turned with them. Hecla Mining [HL], bought on 5th August, is already up 15.2%; B2Gold [BTG] has gone from -16.4% at the month end to +14.1%, and Ero Copper [ERO] from -12.7% to +9.1%. Six of the nine holdings now show a profit, against one at the month end. Orla Mining [ORLA] is the one that has not joined in, unchanged at -31.9%.
Transactions

Since the last newsletter (18th July 2026), just the one transaction – 63 shares in Hecla Mining Co bought on 5th August for USD 1,004.22, which left the cash balance at USD 1,842.61.
US Active 10 (Year 2) Portfolio
The Year 2 portfolio – the same approach, running in its second year – has had the same fortnight with rather more leverage. As at Saturday 15th August it stood at USD 19,544.75 against its USD 10,000 start, up by 95.44%, having added USD 1,813.09 (10.2%) over the month. It is a more concentrated portfolio of six holdings, and the silver producers have done the work: First Majestic Silver [AG] at +214.7%, Coeur Mining [CDE] at +127.5%, Aris Mining [ARIS] at +100.1% and Pan American Silver [PAAS] at +84.0%. The same Hecla purchase was made here on 5th August, for USD 1,013.04.
Mick’s Musings
Taking a Profit, and Putting It to Work
Having spent the lead article arguing that the metals may be turning, it would be a bit odd of me not to tell you what I actually did about it. So here are the three moves I made in the first week of August, and the reasoning behind each.
First, I closed Filtronic [FTC] completely. I bought 557 shares on 2nd January at 179.5p, for GBP 999.82. On 7th May I sold 272 of them at 375p, taking GBP 1,020.00 back off the table – more than the entire original stake – for a gain of 108.9% on that tranche. The balance of 285 shares went on 4th August at 250p, raising GBP 712.50 for a gain of 39.3%. Position closed, GBP 732.69 banked, 73.3% overall.
Now, I could present that as a masterclass in scaling out. It wasn’t. The second tranche left at 125p below the first, and I would be flattering myself considerably to claim I saw that coming. What the first sale did do was take my original capital back out of the position, which meant the remainder was riding on profit rather than on my money – and that is a genuinely different feeling when a share starts drifting. Taking something off the table when a holding has doubled is not clever; it is just sensible housekeeping. I have had years where I failed to do it, and I remember them better than this one.
That freed up cash, and I put it straight back into the theme I have been writing about. On 5th August I bought 214 shares in Hochschild Mining [HOC] at 468.8p, a GBP 1,003.23 first tranche in the UK Active 10. This one did not come out of thin air – Cedric and I had just been through Hochschild’s first-half 2026 production report in some detail, working the production figures and realised prices through to an estimate of turnover, and I liked what came out of it enough to take a starting position. Note the words “first tranche”: if the metals thesis plays out, I may add more (DYOR of course!).
The same afternoon, over in the US Active 10, I bought 63 shares in Hecla Mining [HL] at $15.94, for $1,004.22. Hecla is a primary silver producer, and that is deliberate. If the gold-silver ratio compresses the way it has in past recovery phases, silver is where the leverage sits – the 2020-21 compression produced roughly 40 percentage points of silver outperformance. That is a big if, and I am sizing it accordingly.
So the pattern, if there is one: bank a profit whilst it is on the table, keep the cash working, and put it where the research points rather than where the mood does. If there are no immediate opportunities, then I’m always happy to keep the cash until one emerges from my research. In summary, stay patient, size positions sensibly, and keep watching the fundamentals, the Technical Analysis and the news-flow!
Want to learn more about the techniques and strategies that we employ here at diy-investors.com? Then join our Inner Circle HERE.
Mick
Upcoming Events
AI for Investing (August meeting): Wednesday 26th August 2026 at 7.30pm
Inner Circle webinar: Wednesday 2nd September 2026 at 7.30pm
AI for Investing (September meeting): Wednesday 23rd September 2026 at 7.30pm
Inner Circle webinar: Wednesday 7th October 2026 at 7.30pm
Plaza Group (quarterly webinar): Wednesday 21st October 2026 at 7.30pm
AI for Investing (October meeting): Wednesday 28th October 2026 at 7.30pm
Looking for earlier copies of the Freedom Blueprint?
The post containing the July Newsletter is HERE!
The post containing the June Newsletter is HERE!
The post containing the May Newsletter is HERE!
The post containing the April Newsletter is HERE!
Mick (15th August 2026)