The Freedom Blueprint (September ’26 Edition)

Two Chokepoints, One Problem
Back in April I closed my piece on the Iran conflict with a short note about the Red Sea, calling it the second chokepoint in an already stretched trading system and the one to watch over the coming weeks. On this occasion I would rather have been wrong.
At the time of writing – Saturday 12th September – the Houthis have taken the Yemeni port of Mokha and, on Friday, the island of Perim, which divides the Bab el-Mandeb strait into two shipping lanes. That hands them the Yemeni side of the entrance to the Red Sea, and with it the ability to threaten anything passing through. Over 500 people have been killed in the offensive, and President Trump has so far declined Saudi requests for American strikes on the Houthis.
Whilst that was happening, something quieter happened that matters rather more to the oil price. On Friday Saudi Arabia shut its East-West pipeline after drone strikes launched from Iraq damaged pumping stations and caused injuries. That pipeline runs 1,200 km from the eastern oilfields to Yanbu on the Red Sea and can carry up to 7 million barrels a day. It is the main way round the Strait of Hormuz.
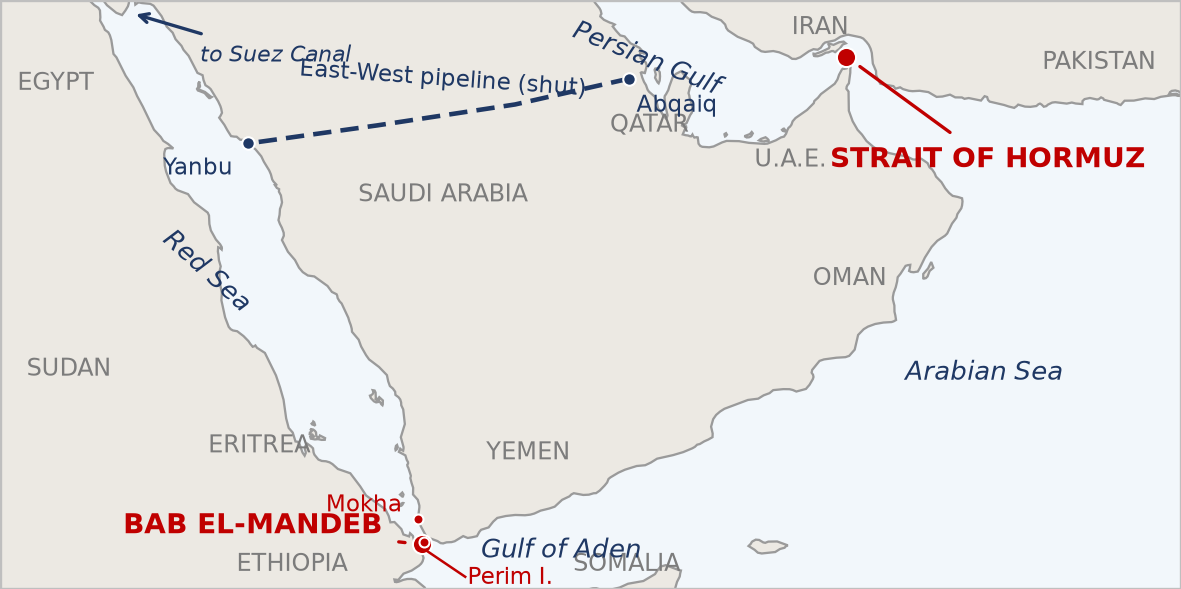
The two chokepoints now compromised at once. Dashed line: the East-West pipeline, shut on 11th September.
And Hormuz is the point. It has been effectively shut since the end of February. In normal times it carries 20.9 million barrels a day of crude and products – roughly a quarter of all seaborne oil trade – plus around a fifth of the world’s liquefied natural gas (LNG), according to the US Energy Information Administration. Ship trackers have been counting single-figure transits on some days, against something like 125 before the war. So Hormuz has been jammed for six months, the pipeline that works round it was damaged last week, and the Bab el-Mandeb now has hostile forces sitting on one side of it. As far as I can tell, we have not had both of the world’s most important oil chokepoints compromised at the same time before.
The market’s response was not quite what you might expect. Brent settled on Friday at $104.61, down 2.8% on the day, with West Texas Intermediate at $100.05 – though both were up around 9% over the week. The fall came on news that Gulf foreign ministers would meet Iran in Oman. Three percent came off the price on one diplomatic headline.
The reason oil is at $105 and not $200 is less comforting than it first appears: demand has fallen too, and hard. That is a story in its own right, and I have given it its own piece below.
For our diy-investors portfolios, the honest observation is that the winners here have already won. Frontline, the tanker owner, made a record $659.2 million in the second quarter against $77.5 million a year earlier, earning $152,700 a day on its very large crude carriers. Maersk has raised its guidance – whilst warning that a return to Suez would shorten voyages, release capacity and push freight rates back down. The awkward part is that peace is what would hurt them. On the other side sit Egypt, whose canal revenue is less than half its 2023 record, Europe’s chemicals and manufacturing, and the UK consumer.
That last one is our real exposure. Consumer Prices Index (CPI) inflation was 2.9% in July, the Bank of England held rates at 3.75% with three of its nine members voting for a rise, and we get August’s figure on the 16th of September with the rate decision the day after.
As you read this, those Oman talks are happening. I am not adding to energy or shipping here – that move has run, and I do not want to ‘chase it’. But I am rather more interested than I was in what my portfolios would do if Brent sat at $105 for a year.
Mick’s Musings
Is That a Recession Signal, or Just an Empty Pipeline?
The number that stopped me in my tracks this month was not the oil price. It was the International Energy Agency saying it expects world oil demand to FALL by 2.5 million barrels a day this year – the largest annual drop since the pandemic. When demand for the one commodity that touches everything goes into reverse on that scale, the obvious question is whether we are looking at the first reading of a global recession.
My honest answer is: not proven, and probably not yet – but the detail underneath is more troubling than the headline.
Here is why I am not treating it as proof. Demand did not fall into a healthy market. Supply fell further and faster – down 5.7 million barrels a day, with more than 10 million barrels a day of Gulf output shut in during August. When the barrels are not physically there, and the price is doing the rationing, demand falls as a matter of arithmetic. That is a supply shock behaving exactly as a supply shock should, not the business cycle rolling over.
Here is why I am not dismissing it either. It matters enormously WHICH barrels went missing, and the Agency is clear that the losses sit in middle distillates and petrochemical feedstock, mostly in Asia. Middle distillates are diesel and gasoil – lorries, ships, tractors and generators. Petrochemical feedstock becomes plastics and manufactured goods. Those are the working barrels of the real economy. If this were simply households cutting back at the pump, petrol would be leading the decline. It is not.
So as DIY-Investors, how can we tell the difference? We need to consider the following scenarios: demand falling whilst prices rise is rationing. Demand falling whilst prices fall is a recession. If the Oman talks succeed, Hormuz reopens, Brent drops back towards $70 or $80 and demand still does not recover – that is our answer, and it will not be a happy one.
In the meantime I have asked Cedric to watch four things that speak before the official statistics do: credit spreads on the weakest borrowers; Korean and Taiwanese exports, the earliest honest read on world trade there is; new orders against inventories in the Purchasing Managers’ Index (PMI); and weekly jobless claims, which are difficult to dress up. As things stand, all four say no recession – which is itself worth knowing.
One warning, because it caught me out. Do not read container freight rates as a demand signal this year. Asia-Europe rates are falling, but that is ships returning to the Suez Canal and shortening their voyages – not shippers ordering less. That held until last week. With the Bab el-Mandeb now threatened, any return to Suez is in doubt – and if those ships turn back round the Cape, the rates will rise again for reasons that have nothing to do with demand either.
The part that concerns me most is what kind of recession this would be. An energy-driven one behaves differently from a credit-driven one: inflation stays high, so there is no rescue from lower interest rates. The Bank of England held at 3.75% with three of its nine members voting for a RISE. There is no help coming from that direction this time.
DIY-Investors Portfolio Updates
UK Active 10 Portfolio
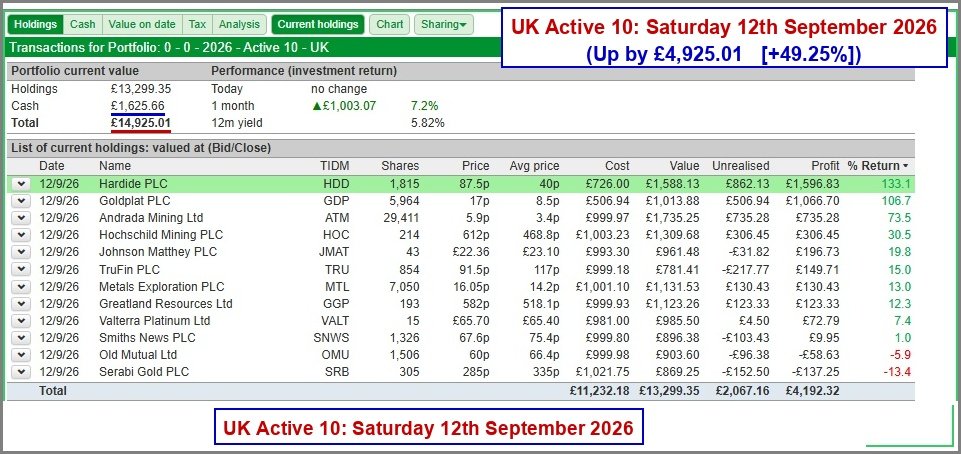
UK Active 10: Saturday 12th September 2026 – Up by GBP 4,925.01 (+49.25%)
As at the close on Friday 11th September the UK Active 10 stood at GBP 14,925.01 against its GBP 10,000 start – up by GBP 4,925.01, or 49.25%. Since the August newsletter (GBP 13,775.56 on 15th August) it has added GBP 1,149.45, a gain of 8.34%. Holdings are GBP 13,299.35 with GBP 1,625.66 in cash, and the twelve-month yield is 5.82%.
Hardide [HDD] remains the standout at +133.1%, followed by Goldplat [GDP] at +106.7% and Andrada Mining [ATM] at +73.5%. At the other end, Serabi Gold [SRB] is down 13.4% and Old Mutual [OMU] down 5.9%.
Transactions
Since the last newsletter (15th August 2026), one item: a dividend of GBP 38.41 from Valterra Platinum on 8th September. That left the cash balance at GBP 1,625.66.
US Active 10 Portfolio
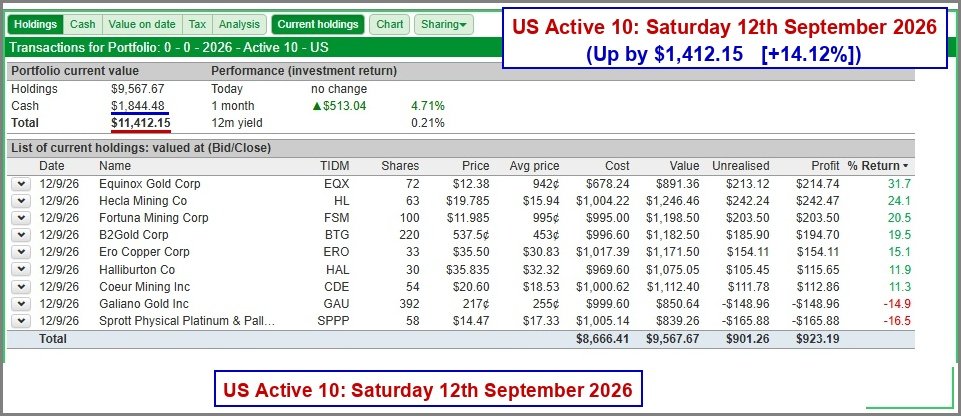
US Active 10: Saturday 12th September 2026 – Up by USD 1,412.15 (+14.12%)
The US Active 10 stood at USD 11,412.15 against its USD 10,000 start – up by USD 1,412.15, or 14.12%. Since the August newsletter (USD 10,671.60 on 15th August) it has added USD 740.55, a gain of 6.94%. Holdings are USD 9,567.67 with USD 1,844.48 in cash.
Equinox Gold [EQX] leads at +31.7%, with Hecla Mining [HL] at +24.1% and Fortuna Mining [FSM] at +20.5%. The weakest are Sprott Physical Platinum and Palladium [SPPP] at -16.5% and Galiano Gold [GAU] at -14.9%.
Transactions
Since the last newsletter (15th August 2026), two items, both dividends: USD 1.62 from Equinox Gold on 2nd September and USD 0.24 from Hecla Mining on 10th September. That left the cash balance at USD 1,844.48.
Getting the Old Key Metrics Page Back
If you moved from Legacy ShareScope to the new version, you may well have had the same problem that I did. You go looking for the one-page Key Metrics view – where everything you wanted about a company sat together – and it is not there any more. Judging by the noise online it is the thing that irritates long-standing users most, and it is not a small complaint – a layout you have read the same way for years is not a cosmetic preference, it is how you think.
So I set about rebuilding it in the new ShareScope’s Custom tab, and I have put the whole thing on video.
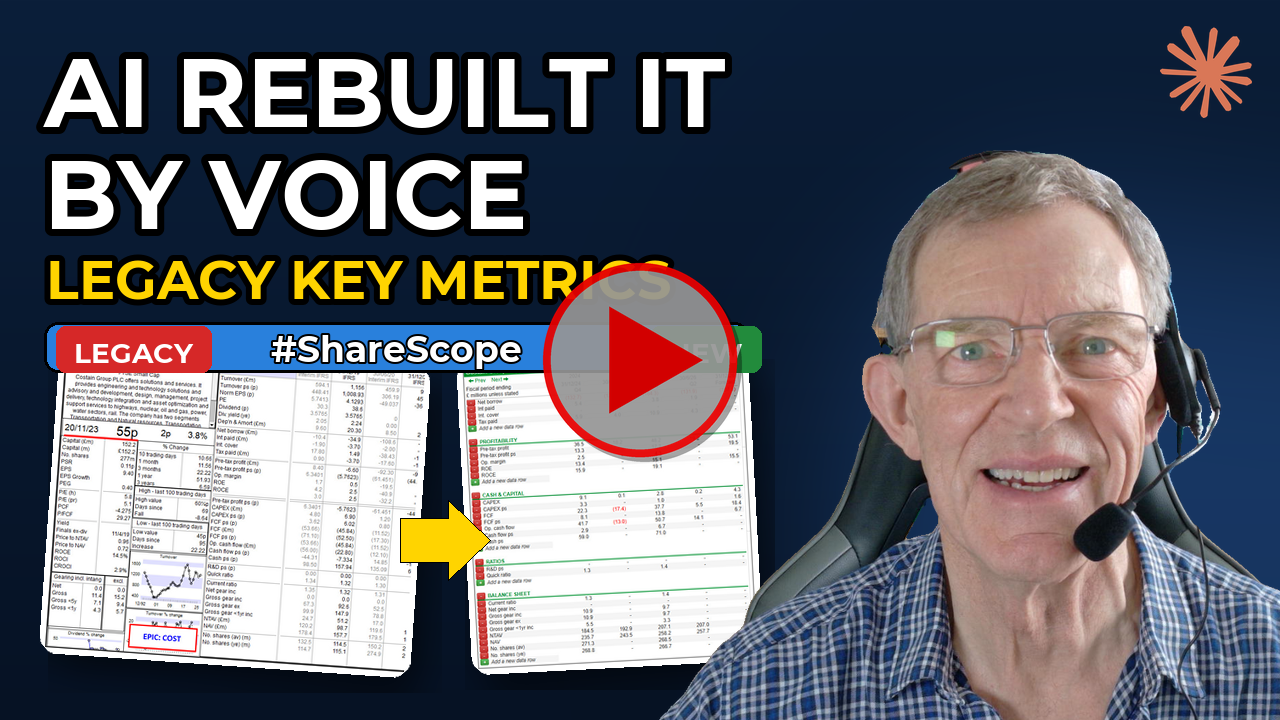
Rebuilding the Legacy Key Metrics page in the new ShareScope – click the image to watch on YouTube.
The first part is the manual route. I add a section and a data row by hand, so you can see exactly how the Custom tab is put together. It is perfectly doable. It is also, if I am honest, a ton of time for anyone who wants the full layout back.
Which is where the second part comes in. I gave Cedric – my AI research assistant – nothing more than a screenshot of the old Legacy Key Metrics page from Costain, and asked him, by voice, to rebuild the whole tab. He did, and I have demonstrated the result on Shell plc. (For the avoidance of doubt, I am not invested in Shell – it is simply a large, familiar company to show the layout on.)
One thing the video does not do, and I want to be straight about it: it does not cover installing or setting up the assistant itself. That is a separate session, and one I am happy to walk through at a future AI for Investing meeting.
The video runs to just under 16 minutes, watch it HERE
Final Thoughts
That is almost it for this month. If the chokepoint story develops I will pick it up again next month, and I will report back on those four indicators either way. The diary dates for September and October are below.
I am not repositioning our diy-investors portfolios on a forecast – I have been wrong about recessions before, and probably will be again. But I am going through both portfolios, holding by holding, asking what this would do to them. Perhaps worth half an hour of your time too?
Upcoming Members’ Webinars
AI for Investing (Sept. Meeting): Wednesday 23rd September 2026 (7.30pm)
Oct ’26 – Inner Circle Webinar: Wednesday 7th October 2026 (7.30pm)
Oct ’26 – Plaza Group Meeting: Wednesday 21st October 2026 (7.30pm)
AI for Investing (Oct. Meeting): Wednesday 28th October 2026 (7.30pm)
Looking for earlier copies of the Freedom Blueprint?
The post containing the August Newsletter is HERE!
The post containing the July Newsletter is HERE!
The post containing the June Newsletter is HERE!
The post containing the May Newsletter is HERE!
Mick (14th September 2026)